時間:2020年8月15日10:25:47
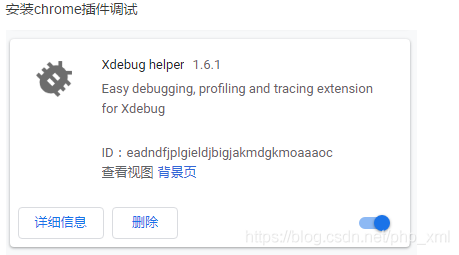
Xdebug插件安裝省略,自己百度安裝���,win和linux環境安裝方式不一樣����。
注意和php版本匹配
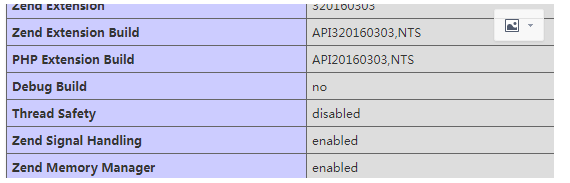
1��、phpinfo信息
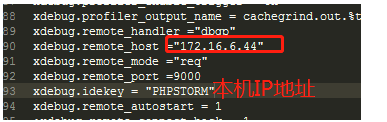
2���、php.ini配置
[xdebug]
zend_extension=/usr/lib64/php/modules/xdebug.so
xdebug.remote_enable =1
xdebug.profiler_enable = On
xdebug.auto_trace=On
xdebug.profiler_enable_trigger = On
xdebug.profiler_output_name = cachegrind.out.%t.%p
xdebug.remote_handler ="dbgp"
xdebug.remote_host ="172.16.6.44"
xdebug.remote_mode ="req"
xdebug.remote_port =9000
xdebug.idekey = "PHPSTORM"
xdebug.remote_autostart = 1
;xdebug.remote_connect_back = 1
; If openssl.cafile is not specified or if the CA file is not found, the
; directory pointed to by openssl.capath is searched for a suitable
; certificate. This value must be a correctly hashed certificate directory.
; Most users should not specify a value for this directive as PHP will
; attempt to use the OS-managed cert stores in its absence. If specified,
; this value may still be overridden on a per-stream basis via the "capath"
; SSL stream context option.
;openssl.capath=

; Local Variables:
; tab-width: 4
; End:

xdebug.var_display_max_children=10240
xdebug.var_display_max_data=10240
xdebug.var_display_max_depth=10240
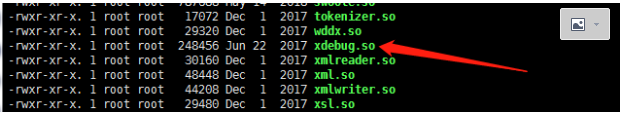
3�、當然你的xdebug.so擴展也要安裝起來���。
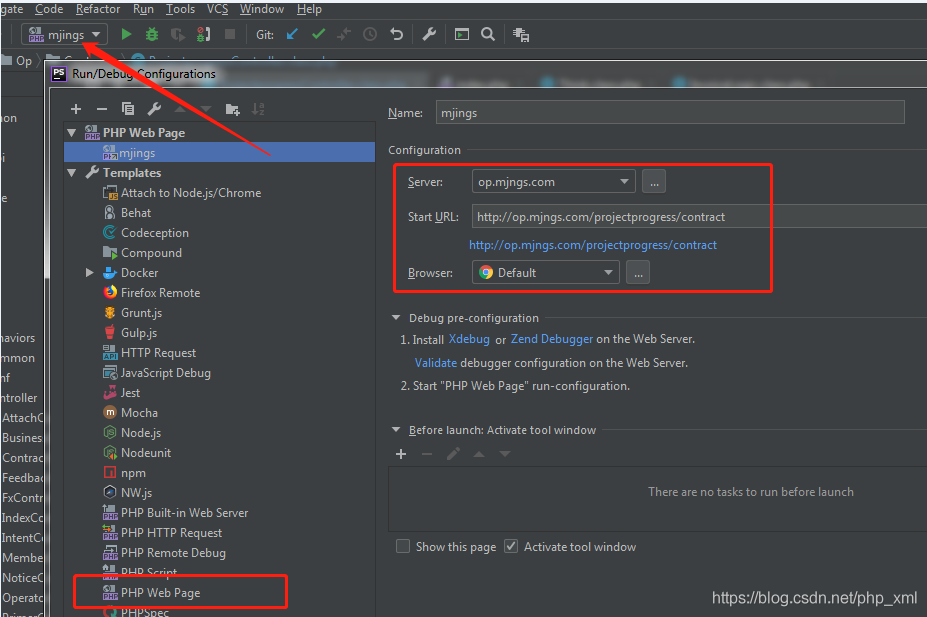
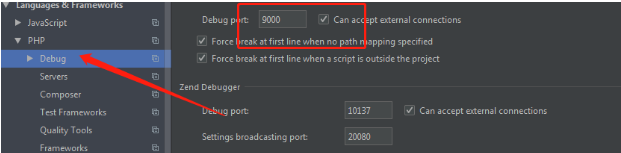
4�、編輯器phpstorm配置
setting配置
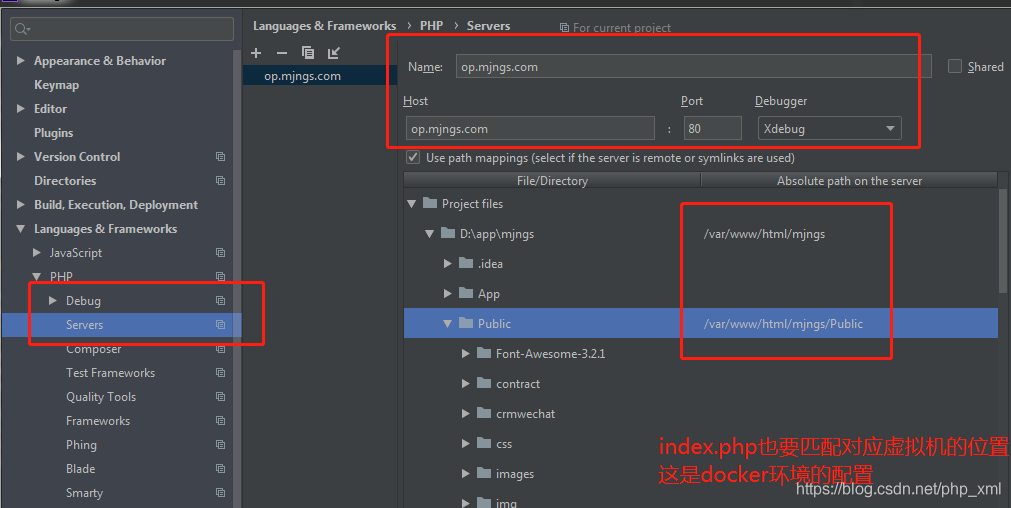
端口和ini中配置的一樣
本機IP配置,虛擬機的IP是192.168.99.26
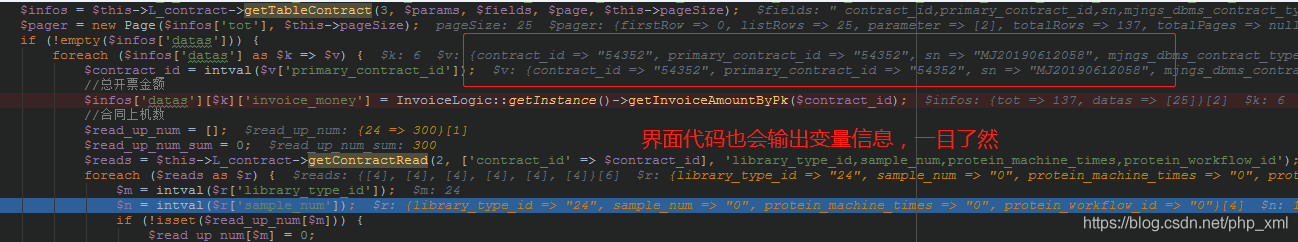
輸出窗口信息
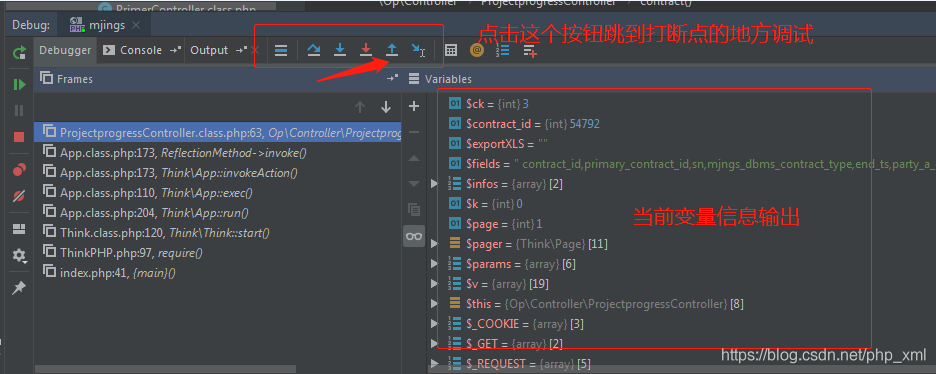
代碼界面輸出
1.首先檢查phpstorm的xdebug配置
->這里的debug port要和php.ini里面的 xdebug.remote_port相一致!默認是9000,如果9000端口被占用的話�,可以改成其他 端口。
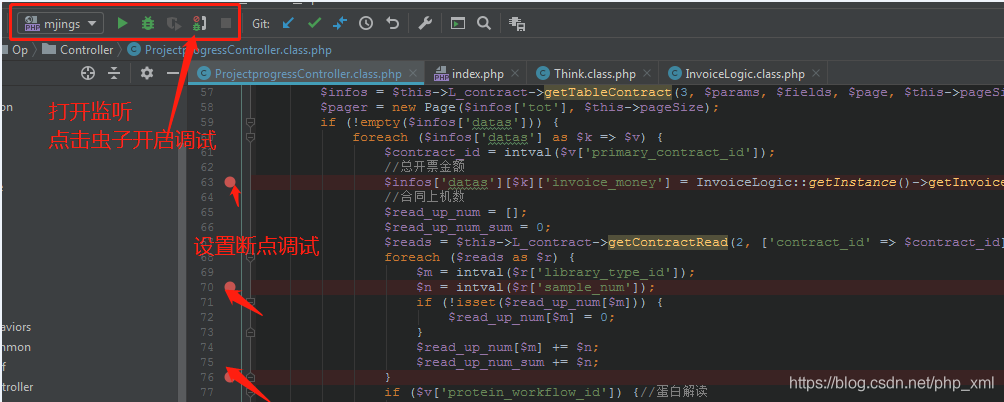
4.開始使用斷點調試
-〉開啟調試(phpstrom)
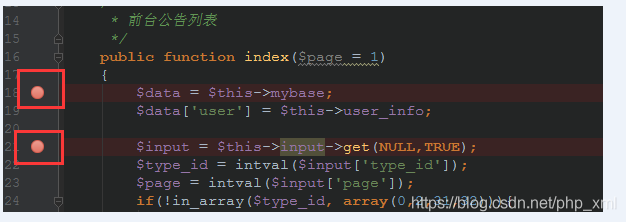
1���、設置斷點
F9跳出
F8下一步
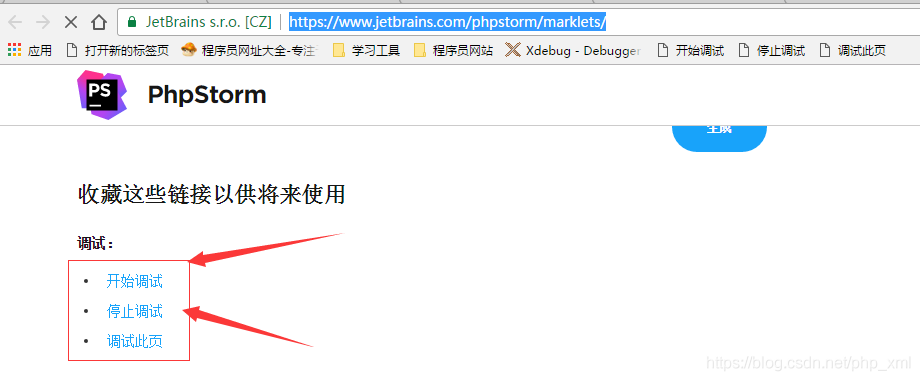
->瀏覽器增加開啟和關閉按鈕
https://www.jetbrains.com/phpstorm/marklets/
-〉在代碼中打斷點,運行訪問該頁面的url
瀏覽器開啟調試���,然后刷新頁面即可。
總結
到此這篇關于php開發最強大的IDE編輯的phpstorm 2020.2配置Xdebug調試的文章就介紹到這了,更多相關phpstorm調試配置 Xdebug內容請搜索腳本之家以前的文章或繼續瀏覽下面的相關文章希望大家以后多多支持腳本之家�����!
您可能感興趣的文章:- 遠程debug調試入門
- idea遠程debug調試部署在tomcat上項目
- idea 無法debug調試的解決方案
- Pycharm debug調試時帶參數過程解析
- Spring Boot Debug調試過程圖解
- 你不知道的 IDEA Debug調試小技巧(小結)
- 因不會遠程debug調試我被項目經理嘲笑了