對于機器學習多分類模型來說,其評價指標除了精度之外,常用的還有混淆矩陣和分類報告,下面來展示一下如何繪制混淆矩陣,這在論文中經常會用到。
代碼如下:
import itertools
import matplotlib.pyplot as plt
import numpy as np
# 繪制混淆矩陣
def plot_confusion_matrix(cm, classes, normalize=False, title='Confusion matrix', cmap=plt.cm.Blues):
"""
- cm : 計算出的混淆矩陣的值
- classes : 混淆矩陣中每一行每一列對應的列
- normalize : True:顯示百分比, False:顯示個數
"""
if normalize:
cm = cm.astype('float') / cm.sum(axis=1)[:, np.newaxis]
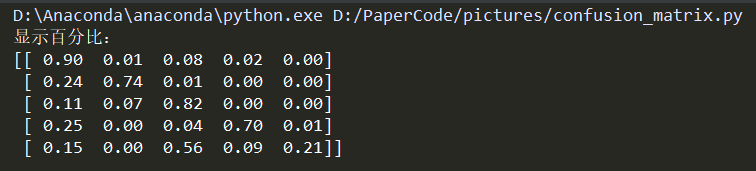
print("顯示百分比:")
np.set_printoptions(formatter={'float': '{: 0.2f}'.format})
print(cm)
else:
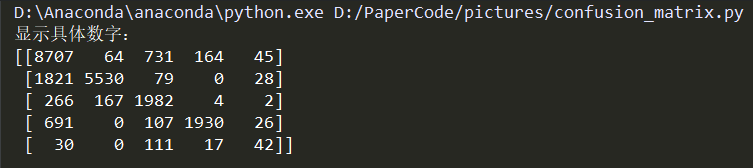
print('顯示具體數字:')
print(cm)
plt.imshow(cm, interpolation='nearest', cmap=cmap)
plt.title(title)
plt.colorbar()
tick_marks = np.arange(len(classes))
plt.xticks(tick_marks, classes, rotation=45)
plt.yticks(tick_marks, classes)
# matplotlib版本問題,如果不加下面這行代碼,則繪制的混淆矩陣上下只能顯示一半,有的版本的matplotlib不需要下面的代碼,分別試一下即可
plt.ylim(len(classes) - 0.5, -0.5)
fmt = '.2f' if normalize else 'd'
thresh = cm.max() / 2.
for i, j in itertools.product(range(cm.shape[0]), range(cm.shape[1])):
plt.text(j, i, format(cm[i, j], fmt),
horizontalalignment="center",
color="white" if cm[i, j] > thresh else "black")
plt.tight_layout()
plt.ylabel('True label')
plt.xlabel('Predicted label')
plt.show()
測試數據:
cnf_matrix = np.array([[8707, 64, 731, 164, 45],
[1821, 5530, 79, 0, 28],
[266, 167, 1982, 4, 2],
[691, 0, 107, 1930, 26],
[30, 0, 111, 17, 42]])
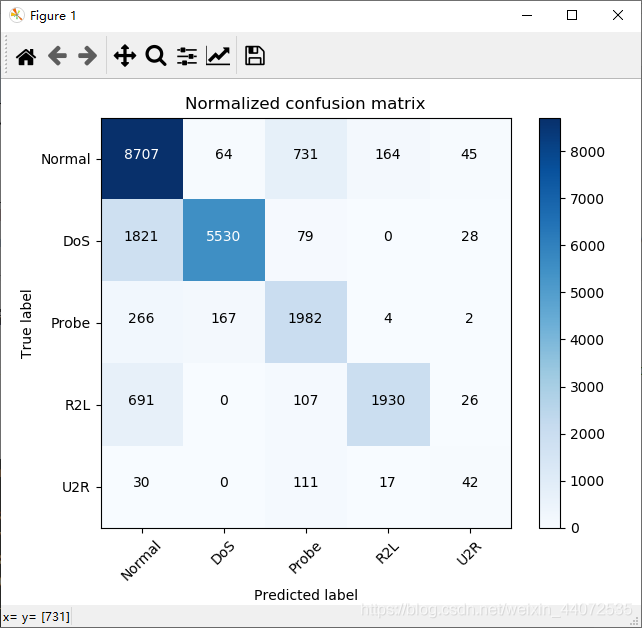
attack_types = ['Normal', 'DoS', 'Probe', 'R2L', 'U2R']
第一種情況:顯示百分比
plot_confusion_matrix(cnf_matrix, classes=attack_types, normalize=True, title='Normalized confusion matrix')
效果:

第二種情況:顯示數字
plot_confusion_matrix(cnf_matrix, classes=attack_types, normalize=False, title='Normalized confusion matrix')
效果:
到此這篇關于Matplotlib繪制混淆矩陣的實現的文章就介紹到這了,更多相關Matplotlib 混淆矩陣內容請搜索腳本之家以前的文章或繼續(xù)瀏覽下面的相關文章希望大家以后多多支持腳本之家!
您可能感興趣的文章:- 利用python中的matplotlib打印混淆矩陣實例
- Python使用matplotlib繪制正弦和余弦曲線的方法示例
- Python matplotlib繪制圖形實例(包括點,曲線,注釋和箭頭)
- matplotlib 曲線圖 和 折線圖 plt.plot()實例
- Python matplotlib 繪制雙Y軸曲線圖的示例代碼
- 使用matplotlib動態(tài)刷新指定曲線實例
- Python使用matplotlib繪制三維參數曲線操作示例
- Python使用matplotlib繪制Logistic曲線操作示例
- Python matplotlib畫曲線例題解析
- matplotlib畫混淆矩陣與正確率曲線的實例代碼