matplotlib默認根據數據系列自動縮放坐標軸范圍。pyplot模塊中的autoscale函數可以切換是否自動縮放坐標軸范圍,xlim()和ylim()函數可手動設置坐標軸范圍。
autoscale函數
對于pyplot模塊控制坐標軸范圍是否自動縮放的函數為autoscale。
函數簽名為matplotlib.pyplot.autoscale(enable=True, axis='both', tight=None)
參數作用及取值如下:
enable為布爾值,即是否自動縮放。axis取值范圍為{'both', 'x', 'y'},默認值為'both',即作用在哪個坐標軸。tight為布爾值,默認值為None,即是否設置邊距為0。
底層相關函數有:
- Axes.autoscale
- Axes.autoscale_view
- Axes.set_autoscale_on
- Axes.get_autoscale_on
- Axes.set_autoscalex_on
- Axes.get_autoscalex_on
- Axes.set_autoscaley_on
- Axes.get_autoscaley_on
案例
自動縮放坐標軸范圍功能對比。
import matplotlib.pyplot as plt

plt.subplot(121)
plt.plot([0.5,0.5])
print(plt.gca().get_autoscale_on())
print(plt.gca().get_autoscalex_on())
print(plt.gca().get_autoscaley_on())
plt.subplot(122)
plt.plot([0.5,0.5])
plt.autoscale(False)
print(plt.gca().get_autoscale_on())
print(plt.gca().get_autoscalex_on())
print(plt.gca().get_autoscaley_on())
plt.show()
輸出:

True
True
True
False
False
False
xlim()函數
手動設置x坐標軸的范圍或獲取x坐標軸的范圍。
函數簽名為matplotlib.pyplot.xlim(*args, **kwargs)。
調用簽名有三種:
xlim((left, right))xlim(left, right)xlim(left=1, right=3)
其中left為x坐標軸左側極值,right為x坐標軸右側極值。注意!left可以比right大!
返回值為(left, right),即坐標軸范圍元組。
xlim()相當于Axes.get_xlim,xlim(*args, **kwargs)相當于Axes.set_xlim。
案例
演示xlim()的調用方法。
import matplotlib.pyplot as plt

plt.figure(figsize=(14, 3))
plt.subplot(141)
plt.plot([1, 1])
print(plt.xlim())
plt.subplot(142)
plt.plot([1, 1])
plt.xlim(0, 1.5)
plt.annotate('plt.xlim(0,1.5)', (0.1, 1.001))
print(plt.xlim())
plt.subplot(143)
plt.plot([1, 1])
plt.xlim((0, 1.5))
plt.annotate('plt.xlim((0,1.5))', (0.1, 1.001))
print(plt.xlim())
plt.subplot(144)
plt.plot([1, 1])
plt.xlim(left=0, right=1.5)
plt.annotate('plt.xlim(left=0,right=1.5)', (0.1, 1.001))
print(plt.xlim())
plt.show()
輸出:
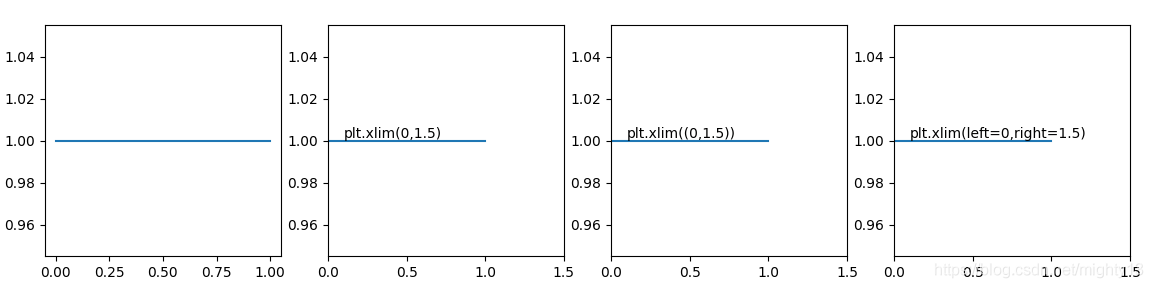
(-0.05, 1.05)
(0.0, 1.5)
(0.0, 1.5)
(0.0, 1.5)
ylim()函數
手動設置y坐標軸的范圍或獲取y坐標軸的范圍。使用方法與xim()函數相似。
函數簽名為matplotlib.pyplot.ylim(*args, **kwargs)。
調用簽名有三種:
ylim((bottom, top))ylim(bottom, top)ylim(bottom=1, top=3)
其中bottom為x坐標軸左側極值,top為x坐標軸右側極值。注意!bottom可以比top大!
返回值為(bottom, top),即坐標軸范圍元組。
ylim()相當于Axes.get_ylim,ylim(*args, **kwargs)相當于Axes.set_ylim。
案例
演示ylim()的調用方法。
import matplotlib.pyplot as plt

plt.figure(figsize=(14, 3))
plt.subplot(141)
plt.plot([1, 1])
print(plt.ylim())
plt.subplot(142)
plt.plot([1, 1])
plt.ylim(0, 1.5)
plt.annotate('plt.ylim(0,1.5)', (0.1, 1.01))
print(plt.ylim(0,1.5))
plt.subplot(143)
plt.plot([1, 1])
plt.ylim((0, 1.5))
plt.annotate('plt.ylim((0,1.5))', (0.1, 1.01))
print(plt.ylim())
plt.subplot(144)
plt.plot([1, 1])
plt.ylim(bottom=0, top=1.5)
plt.annotate('plt.ylim(bottom=0,top=1.5)', (0.1, 1.01))
print(plt.ylim())
plt.show()
輸出:
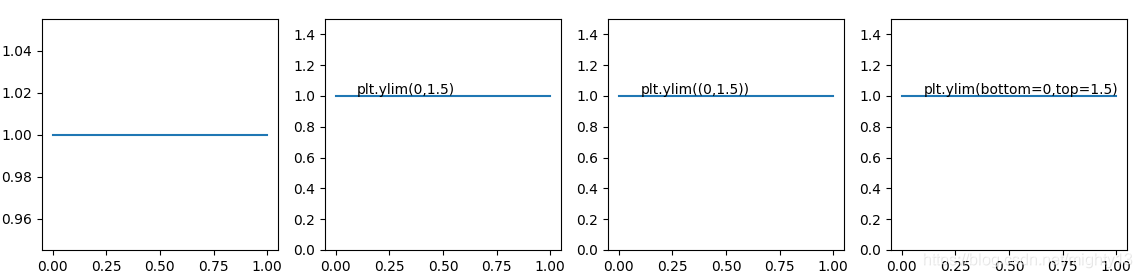
(0.945, 1.0550000000000002)
(0.0, 1.5)
(0.0, 1.5)
(0.0, 1.5)
到此這篇關于matplotlib之pyplot模塊坐標軸范圍設置(autoscale(),xlim(),ylim())的文章就介紹到這了,更多相關matplotlib 坐標軸范圍內容請搜索腳本之家以前的文章或繼續瀏覽下面的相關文章希望大家以后多多支持腳本之家!
您可能感興趣的文章:- Python matplotlib學習筆記之坐標軸范圍