范圍選區(qū)概述
范圍選區(qū)是一種常見的對象選擇方式,在一個子圖中,可以在某一個軸方向上用鼠標選擇起始范圍的數(shù)據(jù),這個特性可用來實現(xiàn)數(shù)據(jù)縮放(datazoom)。在matplotlib中的范圍選區(qū)屬于部件(widgets),matplotlib中的部件都是中性(neutral )的,即與具體后端實現(xiàn)無關(guān)。
范圍選區(qū)具體實現(xiàn)定義為matplotlib.widgets.SpanSelector類,繼承關(guān)系為:Widget->AxesWidget->_SelectorWidget->SpanSelector。
SpanSelector類的簽名為class matplotlib.widgets.SpanSelector(ax, onselect, direction, minspan=None, useblit=False, rectprops=None, onmove_callback=None, span_stays=False, button=None)。
SpanSelector類構(gòu)造函數(shù)的參數(shù)為:
ax:范圍選區(qū)生效的子圖,類型為matplotlib.axes.Axes的實例。onselect:范圍選區(qū)完成后執(zhí)行的回調(diào)函數(shù),函數(shù)簽名為def func(min, max),min、max的數(shù)據(jù)類型均為浮點數(shù),表示選區(qū)在某個坐標軸方向上的最小值和最大值。direction:范圍選區(qū)的坐標軸方向,取值范圍為{"horizontal", "vertical"},類型為字符串。minspan:選區(qū)的最小范圍,選區(qū)范圍小于minspan將不會觸發(fā)onselect。rectprops:范圍選區(qū)的外觀的屬性,默認值為None。span_stays:布爾值,是否在鼠標釋放后仍然保留選區(qū),默認值為False。onmove_callback:當選區(qū)確定后移動鼠標觸發(fā)的回調(diào)函數(shù),函數(shù)簽名為def func(min, max),min、max的數(shù)據(jù)類型均為浮點數(shù),默認值為None。
SpanSelector類中的state_modifier_keys公有變量 state_modifier_keys定義了操作快捷鍵,類型為字典。
案例:范圍選取基本實現(xiàn)
官方案例一,范圍選區(qū)基本實現(xiàn)。
案例說明
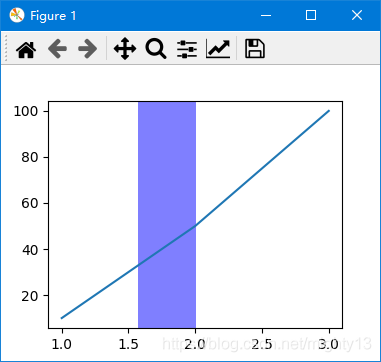
單擊鼠標拖動到適當位置釋放鼠標形成范圍選區(qū),選區(qū)為透明度0.5藍色,控制臺輸出選區(qū)在橫坐標軸上的最大、最小坐標。
控制臺輸出:
1.569758064516129 2.0044354838709677
案例代碼
import matplotlib.pyplot as plt
import matplotlib.widgets as mwidgets
fig, ax = plt.subplots()
ax.plot([1, 2, 3], [10, 50, 100])
def onselect(vmin, vmax):
  print(vmin, vmax)
rectprops = dict(facecolor='blue', alpha=0.5)
span = mwidgets.SpanSelector(ax, onselect, 'horizontal',span_stays=True,
               rectprops=rectprops)
plt.show()
案例:數(shù)據(jù)縮放功能
官方案例,https://matplotlib.org/gallery/widgets/span_selector.html
案例說明
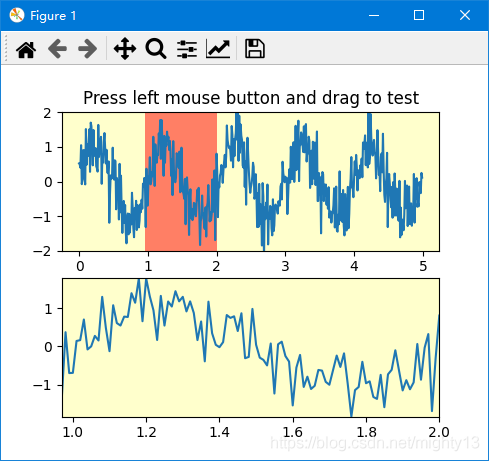
在上方子圖單擊鼠標拖動到適當位置釋放鼠標形成范圍選區(qū),選區(qū)為紅色,下方子圖重繪為選定區(qū)域內(nèi)數(shù)據(jù)系列,起到了數(shù)據(jù)放大的效果。
案例代碼
import numpy as np
import matplotlib.pyplot as plt
from matplotlib.widgets import SpanSelector

# Fixing random state for reproducibility
np.random.seed(19680801)

fig, (ax1, ax2) = plt.subplots(2, figsize=(8, 6))
ax1.set(facecolor='#FFFFCC')

x = np.arange(0.0, 5.0, 0.01)
y = np.sin(2*np.pi*x) + 0.5*np.random.randn(len(x))

ax1.plot(x, y, '-')
ax1.set_ylim(-2, 2)
ax1.set_title('Press left mouse button and drag to test')

ax2.set(facecolor='#FFFFCC')
line2, = ax2.plot(x, y, '-')


def onselect(xmin, xmax):
  indmin, indmax = np.searchsorted(x, (xmin, xmax))
  indmax = min(len(x) - 1, indmax)

  thisx = x[indmin:indmax]
  thisy = y[indmin:indmax]
  line2.set_data(thisx, thisy)
  ax2.set_xlim(thisx[0], thisx[-1])
  ax2.set_ylim(thisy.min(), thisy.max())
  fig.canvas.draw()

span = SpanSelector(ax1, onselect, 'horizontal', useblit=True, span_stays=True,
          rectprops=dict(alpha=0.5, facecolor='red'))
# Set useblit=True on most backends for enhanced performance.

plt.show()
到此這篇關(guān)于matplotlib 范圍選區(qū)(SpanSelector)的使用的文章就介紹到這了,更多相關(guān)matplotlib 范圍選區(qū)內(nèi)容請搜索腳本之家以前的文章或繼續(xù)瀏覽下面的相關(guān)文章希望大家以后多多支持腳本之家!
您可能感興趣的文章:- Python matplotlib學(xué)習(xí)筆記之坐標軸范圍
- Python設(shè)置matplotlib.plot的坐標軸刻度間隔以及刻度范圍