'''
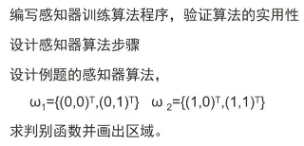
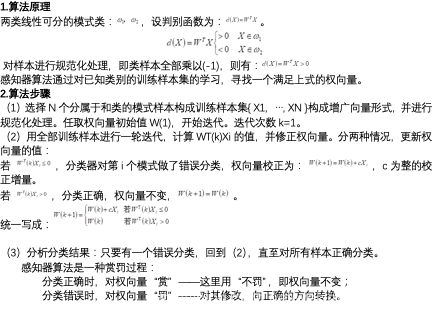
20210610 Julyer 感知器
'''
import numpy as np
import matplotlib.pyplot as plt
def get_zgxl(xn, a):
'''
獲取增廣向量
:param x: 數組
:param a: 1或-1
:return:
'''
temp = []
if a == 1:
xn.append(1)
if a == -1:
for i in range(len(xn)):
temp.append(xn[i]*(-1))
temp.append(-1)
xn = temp
# print('xn:'+ str(np.array(x).reshape(-1, 1)))
return np.array(xn).reshape(-1, 1)
def calculate_w(w, xn):
'''
已知xn和初始值��,計算w
:param w: 列向量 --> wT:行向量
:param xn: 列向量
:return:
'''
# wT = w.reshape(1, -1) # 列向量轉變為行向量����,改變w
wT = w.T # 列向量轉變為行向量��,不改變w
wTx = np.dot(wT, xn).reshape(-1) # 行向量乘以列向量, 維度降為1���。
#wTx = wT@xn # 行向量乘以列向量
if wTx > 0:
w_value = w
else:
w_value = np.add(w, xn)
# print("w_update的shape" + str(w_update.shape))
#print("wTx:" + str(wTx))
return w_value, wTx # w_value為列向量, wTx為一個數
def fit_one(w1, x1, x2, x3, x4):
'''
完成一輪迭代�,遍歷一次數據,更新到w5。
:param w1: 初始值
:param x1:
:param x2:
:param x3:
:param x4:
:return: 返回w5和wTx的列表。
'''
wTx_list = []
update_w = w1
for i in range(0, len(x_data)): #len計算樣本個數�,通過循環更新w
update_w, wTx = calculate_w(update_w, x_data[i])
wTx_list.append(wTx)
#print(wTx_list)
return update_w, wTx_list
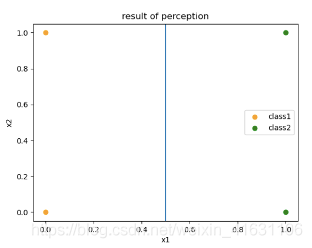
def draw_plot(class1, class2, update_w):
plt.figure()
x_coordinate = []
y_coordinate = []
for i in range(len(class1)):
x_coordinate.append(class1[i][0])
y_coordinate.append(class1[i][1])
plt.scatter(x_coordinate, y_coordinate, color='orange', label='class1')
x_coordinate = []
y_coordinate = []
for i in range(len(class2)):
x_coordinate.append(class2[i][0])
y_coordinate.append(class2[i][1])
plt.scatter(x_coordinate, y_coordinate, color='green', label='class2')
w_reshape = update_w.reshape(-1)
#print
x = np.linspace(0, 2, 5)
if w_reshape[1] == 0:
plt.axvline(x = (-1) * w_reshape[2]/w_reshape[0])
else:
plt.plot(x, (x*w_reshape[0]*(-1) + w_reshape[2]*(-1))/w_reshape[1])
plt.title('result of perception')
plt.xlabel('x1')
plt.ylabel('x2')
plt.legend()
plt.show()
if __name__ == '__main__':
x1 = [0, 0]
x2 = [0, 1]
x3 = [1, 0]
x4 = [1, 1]
class1 = [x1, x2]
class2 = [x3, x4]
x1 = get_zgxl(x1, 1)
x2 = get_zgxl(x2, 1)
x3 = get_zgxl(x3, -1)
x4 = get_zgxl(x4, -1)
x_data = [x1, x2, x3, x4]
# print(x_data)
w1 = np.zeros((3, 1)) # 初始值w1為列向量
#print('w1:' + str(w1) + '\n')
update_w = w1
update_w, wTx_list = fit_one(update_w, x1, x2, x3, x4)
count = 0
iter_number = 0
for wTx in wTx_list:
if wTx > 0:
count += 1
if count 4:
update_w, wTx_list = fit_one(update_w, x1, x2, x3, x4)
iter_number += 1
else:
break
print('迭代次數為:' + str(iter_number))
print('迭代終止時的w:'+'\n' + str(update_w))
#print(wTx_list)
draw_plot(class1, class2, update_w)
到此這篇關于詳解如何用Python實現感知器算法的文章就介紹到這了,更多相關Python實現感知器算法內容請搜索腳本之家以前的文章或繼續瀏覽下面的相關文章希望大家以后多多支持腳本之家����!